This chapter describes the main screen of the Report Module and covers general procedures for issuing reports as follows:
Sample printouts of the standard report formats pre-loaded into the Report Module are shown in the separate publication titled the “Sample Reports Booklet”.
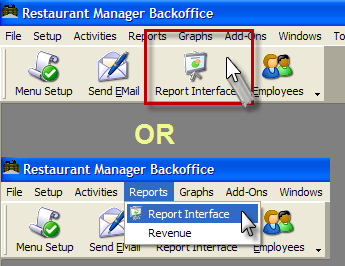
To access the Report Module from the main screen of the Backoffice Module:
You may also access the report module by placing a shortcut to RMReport.exe on the desktop.
The shortcut can be obtain by linking to the executable file located in the rmwin directory or going to Windows “Start” > Programs > Restaurant Manager, Version xxx > RM Reports and “Send To” Desktop (create shortcut).
Please note the following features of the main screen of the Report Module:
The area on the left of the main Report Module Screen is called the Report List or Tree. The standard Backoffice reports pre-loaded into the Report Module are displayed on the Report List under the following group headings:
If any other group headings appear on the Reports List of your system, then your system has been customized with additional Report Groups.
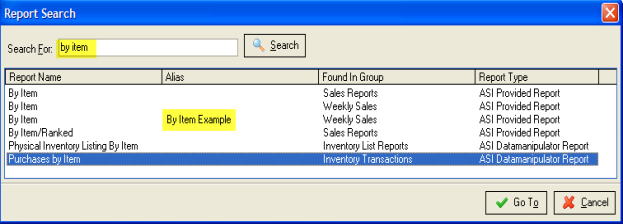
You can use the [Find Report] button to quickly locate a report from the list over 130 standard reports. Clicking on the button will produce a search screen where you can either type in a few letters contained within the name of the report or the full name. The more letters typed will limit the search results. Hit the [Search] button once the data is typed in the “Search For” field. The Report Search screen is divided into four columns:
You can go directly to the report by first highlighting the report from the list under the Report name column and then either clicking on the report name or using the [Go To} button at the bottom of the screen.
In the sample screen shot below, we have typed in “by item” in the search filed. This has produced six reports containing the words “by item”. Notice the third report listed has an alias name.
All the headings on the Report List constitute “Report Groups”. Each report group contains reports relevant to the report group name. You may use the button labeled [Print All Reports in ….] to automatically issue all the reports under any group heading. This print option is typically used with report groups containing a small number of reports.
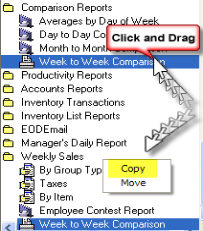
RMReports allows you to create custom groups containing reports more relevant to your business needs and increase the ease of use. You can also copy existing report formats under the new heading to create customized report groups. In addition, you can create new reports and save them under these customized group headings.
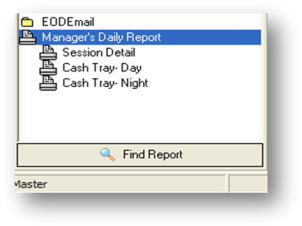
Report Groups are often used to create sets of reports you might wish to print on a regular basis. For instance you might wish to create a group of Daily Sales Reports that included:
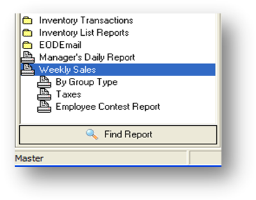
…or a group of Weekly Sales Reports that included:
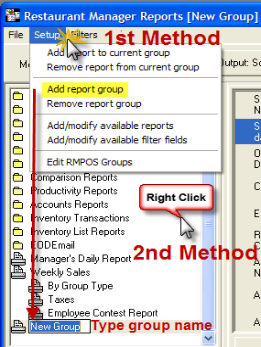
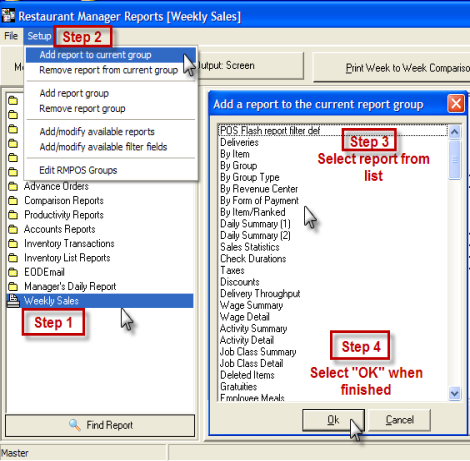
There are two methods you can use to a new report group:
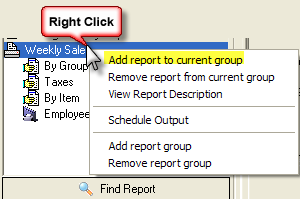
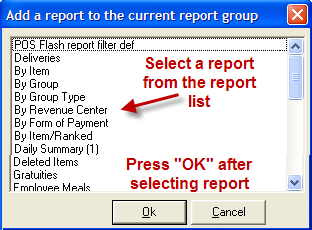
There are three methods you can use to add a report to a new group:
You can then select the desired report and finish by pressing the “OK” function button.
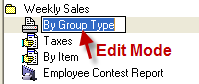
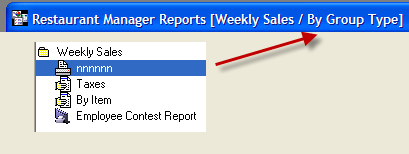
Select the group or report name and click a second time. The field will go into edit mode. Modify the name as desired.
Note that modified report names will appear on the report title bar with the original name.In the illustration below we have renamed a report but the original name appears in the title bar (By Group Type).
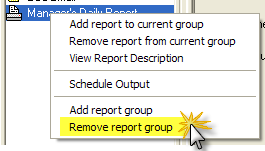
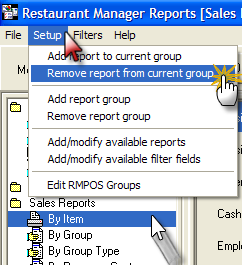
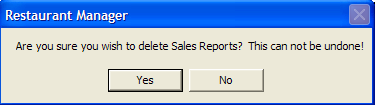
You may remove a report from a report using one of two methods:
In both methods you will receive a confirmation prompt asking if you “wish to delete” the selected report group.
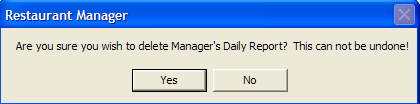
You may remove a report from a report using one of two methods:
In both methods you will receive a confirmation prompt asking if you “wish to delete” the selected report.
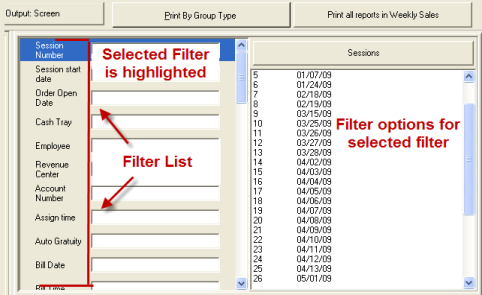
Each report is associated with a list of available filters, shown in the center area of the screen.Selecting a particular filter causes the appropriate filter options to appear in the right area.
Once a report is selected, the list of the available filter fields appears in the middle list box. To create a filter (also referred to as a query or selection formula), simply select a field, and either type in the condition or use the field options in the right panel to click in the desired parameters. You may do this for as many fields as you like, but bear in mind that the more complicated the filter, the longer it will take to generate the report.
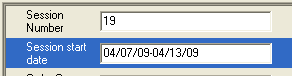
Very Important: Filter fields are logically “And-ed”, so be careful when creating complex filter expressions. For example, if a filter consists of session filter field set to 19 (for April 7, 2009, say) and a date field set to span April 7, 2009 to April 13, 2009, the report will only display data for Session 19 (April 7, 2009).
You can also add “recurring day” filters such as “current month” or “last month” that change with time by use of the combo box located at the top of the right panel. This is useful when creating report groups that a printed on a recurring basis such as the end of day or end of month.
Note: Variable filters are only available for selected date and numeric fields.
If you manually enter filter expressions directly, you can use the following operators.
Note that by use of ranges and independent values you can implement “equals”, “less than” and “greater than” expressions. For example, if you wish to filter out all values not equal to 9999, enter “0-9998, 10000-99000”. If all you are interested in is values less than 9999, then the range“0-9998” will suffice.
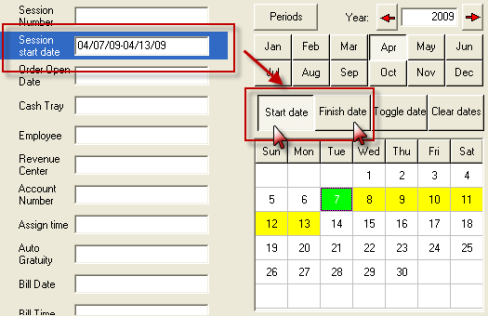
To select a range of dates for a date filter field, first click on the “Start Date” button and use the buttons above and below to select the year, month, and day. Then repeat the process for the “End Date.”
Alternatively, type the date range directly into the filter field.
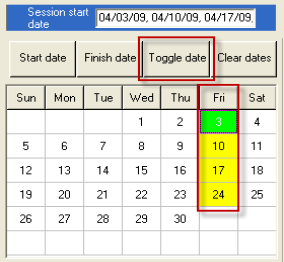
Use the Toggle Date button to include non-contiguous dates in the filter expression. For example, you could click on all the Fridays of the month.
To create more complex date filter expressions, you can also enter them directly into the filter field using the syntax described above. For example, to get data for the first 5 days of January and February, 2003 you would write:
04/01/09-04/10/09, 05/1/09-05/7/09
(Note the comma between April and May ranges)
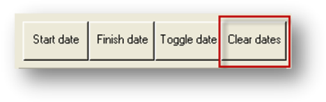
Use the “Clear Dates” button to delete the current filter setting.
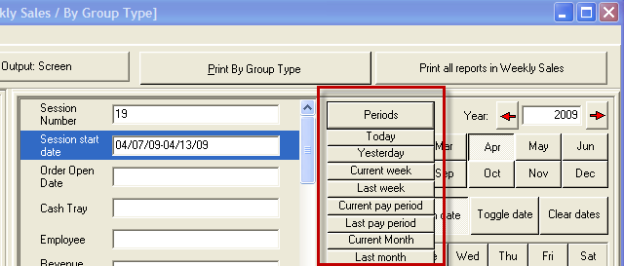
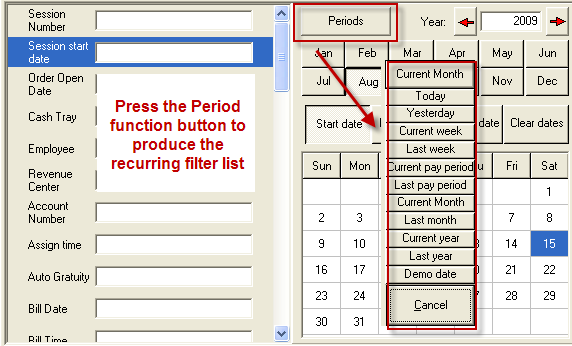
Set a recurring period filter by use of the “Periods” button. Use this type of filtering to issue reports on a daily, weekly or monthly basis, for a particular day of the week, or for payroll periods. For example, if you want a report to always reflect information for the current month, you would select the “Current Month” period option. This will fill the filter field with the expression %Current Month%. If you now save the filter, every time you run this report in the future you will obtain the current month’s information, without having to re-enter the filter expression. This feature is especially useful when configuring report sets printed from a task scheduler.
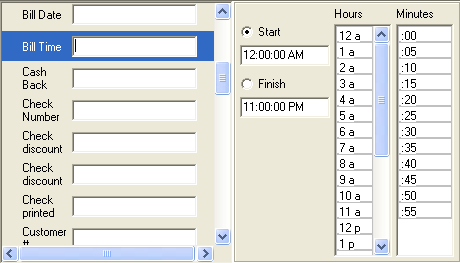
Use the time selection controls in the right panel to enter time filters. To set a time range, first select the Start radio button followed by the hour and then minutes from the appropriate time columns. Next, select the “Finish”radio button followed by the hour and then minutes from the appropriate time columns.
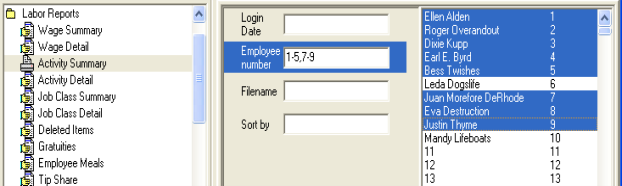
To select a range of numbers for a numeric filter field, such as a quantity or monetary value, write the range into the filter field or use the selection help in the right panel if available. If using the right panel to create the filter, you can click and drag to indicate a range, or hold down the Ctrl key to add non-contiguous values. In the example shown below, employees 1 thru 5 were selected by clicking on 1 and dragging to 5, and then clicking on employees 7, 8 and 9 while holding the control key.
To create more complex numeric expressions, you must always enter them directly into the filter field using the syntax described above.
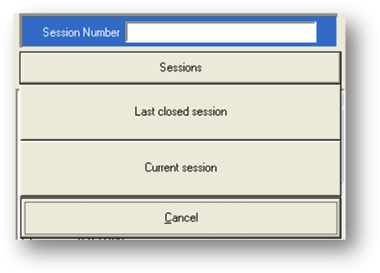
Some filter fields will allow dynamically allocated values. For example, the Session number filter allows you to set the filter to the “Last closed Session” or the “Current Session.” as shown below.
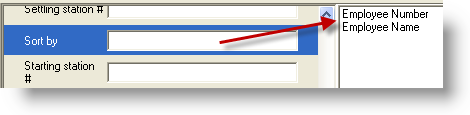
Some reports offer sorting options. The fields are easily identified by the word “sort” at the beginning of the field description. To set, click on the filter field and use the options in the right panel to configure the type of sorting to use.
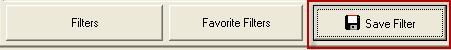
Save Filter
Use the “Save Filter” at the bottom of the screen to record the filter setting for the selected report. The report will thereafter use the saved filter by default until cleared or overwritten by a new filter.
The Filter option at the bottom of the screen allows the user a host of various options to apply or remove filters. The same filter options are available under the “Filters” drop down menu located on the menu bar at the top of the screen. The following is a list of the filter options and a brief description of their characteristics:
Using this function will not affect other used fields that are not the same as copied ones.
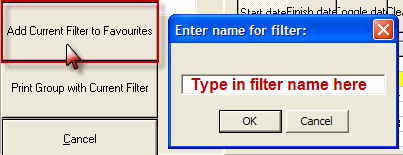
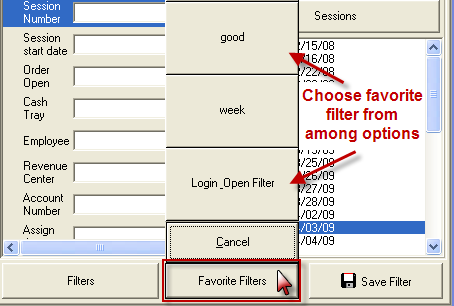
The filter will be available by selecting the “Favorite Filters” option at the bottom of the report module.
Use the Favorite Filter option at the bottom of the report screen to affect a list of previously saved favorite filters for application to selected reports.
Note: Favorite Filters can be deleted using the Edit Favorite Filters using the "Filters" button
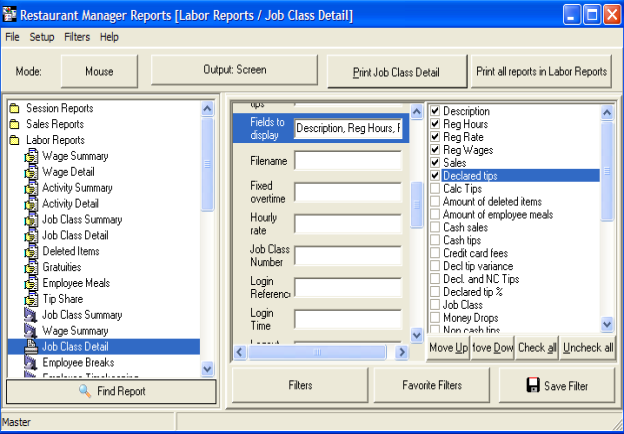
Some ASI type reports allow you to select the columns that are displayed in the report. To obtain a list of the available columns, find the “Fields to Display” field in the middle panel. A list of the available fields will appear in the right panel. Specify the data you wish to appear in the report by checking the appropriate boxes on the left of the description. You can also affect the order in which the columns appear by click and dragging them into position.
As example, to issue a report that only shows the employee name; regular hours, regular pay rate, regular wages, sales, and declared tips then select the “Fields to Display” filter field toward the end of the list in the middle panel, and then check the “appropriate fields from the panel list on the right.
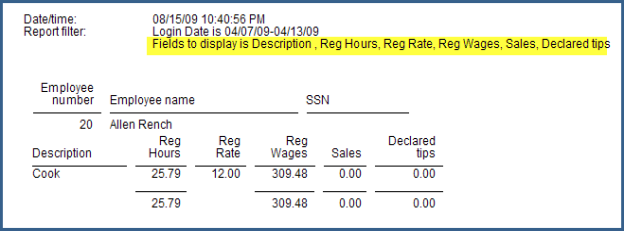
The field settings above will produce a report that will look like the sample section of the Job Class Detail Report below:
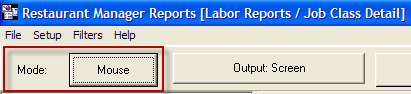
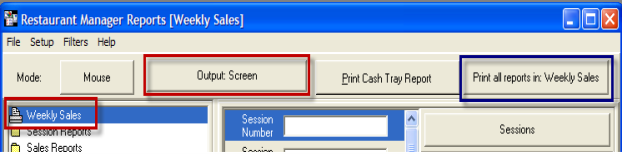
The Report Module can between two input modes: “Mouse” and “Touchscreen”. When using the Report Module at a Manager Workstation it is recommended that you never change the input mode of the Report Module. For more information on the Mode button see the section on the POS Reports.
The [Output] button at the top of the main screen of the Reports Module allows you to select whether a report will be sent to:

Note that the File CSV option is only implemented for the ASI type reports.
To issue an individual report from the main screen of the Report Module:
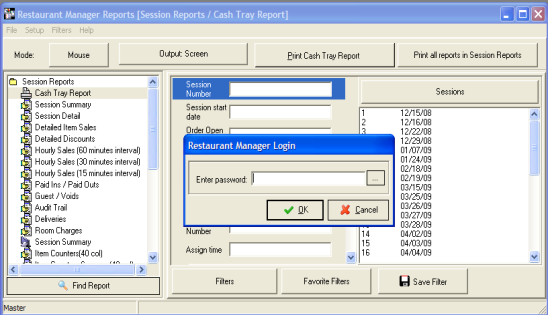
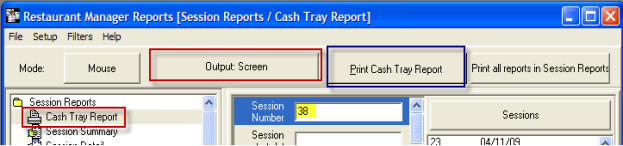
In the screen shot below we have selected the Cash Tray Report for Session 38 to print to the screen:
To issue all the reports under a particular group heading in the Report Module:
In the screen shot below we have selected the custom group report “Weekly Sales” to print to the printer:
Remember that the individual reports are set separately.
By use of a task scheduling utility you can configure RMREPORTS to print the reports in any report group automatically at any given time using the command line syntax described below.
RMREPORTS.EXE <Working Directory> <Output Destination> <Report Group Name>
Where,
<Working Directory> is the directory where Restaurant Manager resides.
<Output destination> is /PRINT for output to the printer, /FILE for output to a text file and /CSV for output to a text file in comma delimited format.
<Report Group Name> is the full report group name as it appears in the RMREPORTS tree view.
Example: RMREPORTS.EXE F:\rmwin /PRINT “Daily Reports”
Note that if there are any spaces in the report group name you must enclose the name in quotes.
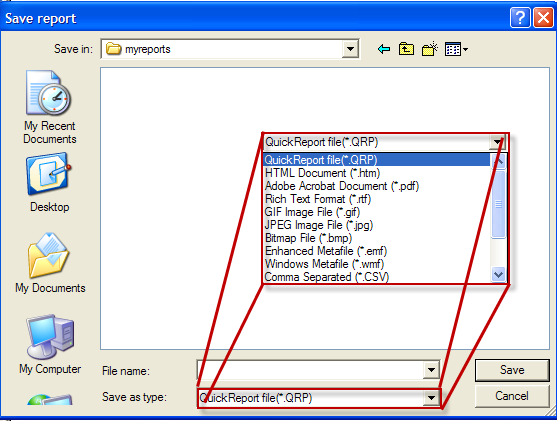
File Output (All reports)
Choosing this option will export the report to a file in the format indicated by the filename extension (suffix.) Supported file types are
Use the filename filter option at the end of the filter list to enter the name of the desired output file. If the name of the file is omitted altogether, the report is saved in text format using the report’s name as the filename with an added .txt extension. If the filename extension is omitted, the report is saved without extension (not recommended!) in text format.
File CSV Output (ASI Type Reports only)
Choosing this option will export the report to a comma delimited text file. The name of the file is set by default to be the same as that of the report with a .csv suffix. To override the default name, use the filename filter option. The exported file will contain a record for every detail line in the report with additional preceding columns for the group and summary information. So, for example, if you exported a report of menu items sold grouped by group, with item totals at the end of each group, the header in the exported file might look like this:
Sum Quantity, Group #, Item #, Item Description, Quantity
In the data, the “Group #” and the “Sum Quantity” would be the same for every item in the group.
The export capability of RMREPORTS can be very valuable when providing information to third parties, such as timekeeping information to payroll handling companies, thus avoiding the errors that invariably happen when hand keying information.
Comma delimited files can also be imported into spreadsheets, so that you can take advantage of the extensive data analysis tools provided by these applications (filters, sorts charts, pivot tables, etc.)
Choosing this option will export the report to a xml file. The name of the file is set by default to be the same as that of the report with an .xml suffix. To override the default name, use the filename filter option. The XML format option is meant to facilitate the interface to RMReports from a programming standpoint. In other words, if another program needs to extract information from a report the easiest way to do it would be from an XML file. It is the universal format for self-describing STRUCTURED data... where “structured” is the key. In XML a program will be looking for <total>120</total> XML tag and it will not care where this tag is placed (second or third column). Compare this to CSV where the data is formatted like this:
Order#, Total
10,120
If a third party program reads this file it will expect to have "Total" as the second column. If at a later date RM adds "Date" between Order# and Total, that program will no longer be able to operate because the total is the third column now.
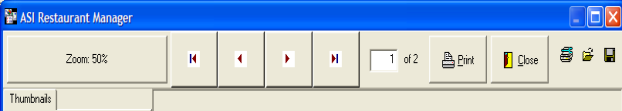
Restaurant Manager allows the user to preview report before printing or just to view on screen. From the preview screen you can send the report to a printer, access printer properties, or use the various save functions.
There are several function buttons located at the top of the screen allowing you to easily navigate the report:
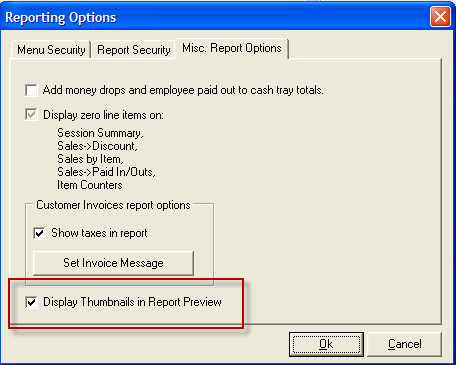
Restaurant Manager has included Thumbnails functionality to the RM Report module. Thumbnails are reduced-size versions of pictures and document pages, used to help in recognizing, organizing and navigating them. Thumbnails are particularly useful for large documents. Because of their usefulness, thumbnails have become increasing popular and have become common place in most document programs (e.g. pdf and Word). RMReports by default, thumbnail pictures of the document will appear on the left side of the screen when a report’s output is set to and printed to “screen”. You can navigate through the document using the scroll bar directly to the right of the thumbnail images or using the wheel of a mouse.
However, Restaurant Manager has provided a way to remove the Thumbnail function off if so desired. In the Report Module go to File > Report Options and do the following:
Use the [Print] button to send the on screen report to a printer.
Use the [Close] button to leave the report and return to the default RMReport screen.
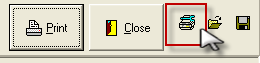
After previewing the report you may wish to print one or several pages of the report. You may also want to print several copies or affect the page orientation (landscape vs. portrait). Use the printer icon on the upper right side of the screen to access printer properties where you will make these changes.
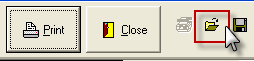
Restaurant Manager allows the user to save reports with a .qrp format. These reports can be viewed using the open folder icon located at the upper right hand corner of the screen.
To open a QRP report:
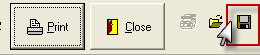
Restaurant Manager allows you two methods to save and export a report in a different format. One method is to use the filename field of the report filter options. The other method is to use the disk icon in the upper right corner of the screen.
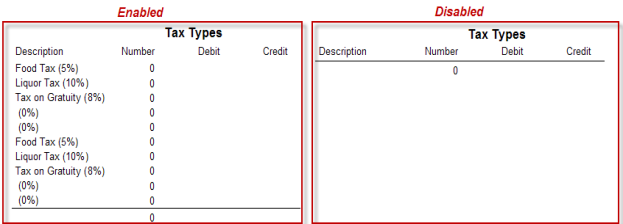
Some of the reports provided allow customization by selection of the columns, or fields, to include in the reports. The reports are:
To customize, select the “Fields to Display” or “Blocks to Display” field and check the parameters you wish to show on the report.
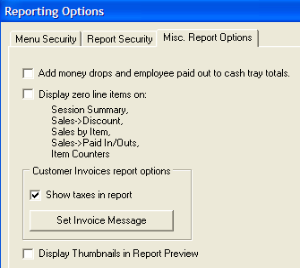
You may also affect information displayed on several reports under the Misc Report tab under File > Report Options:
It should be mentioned that all reports listed under this function will be affected and will make all reports larger due to the increases amount of data shown.
(continued in Scheduling and Emailing Reports)